Task8
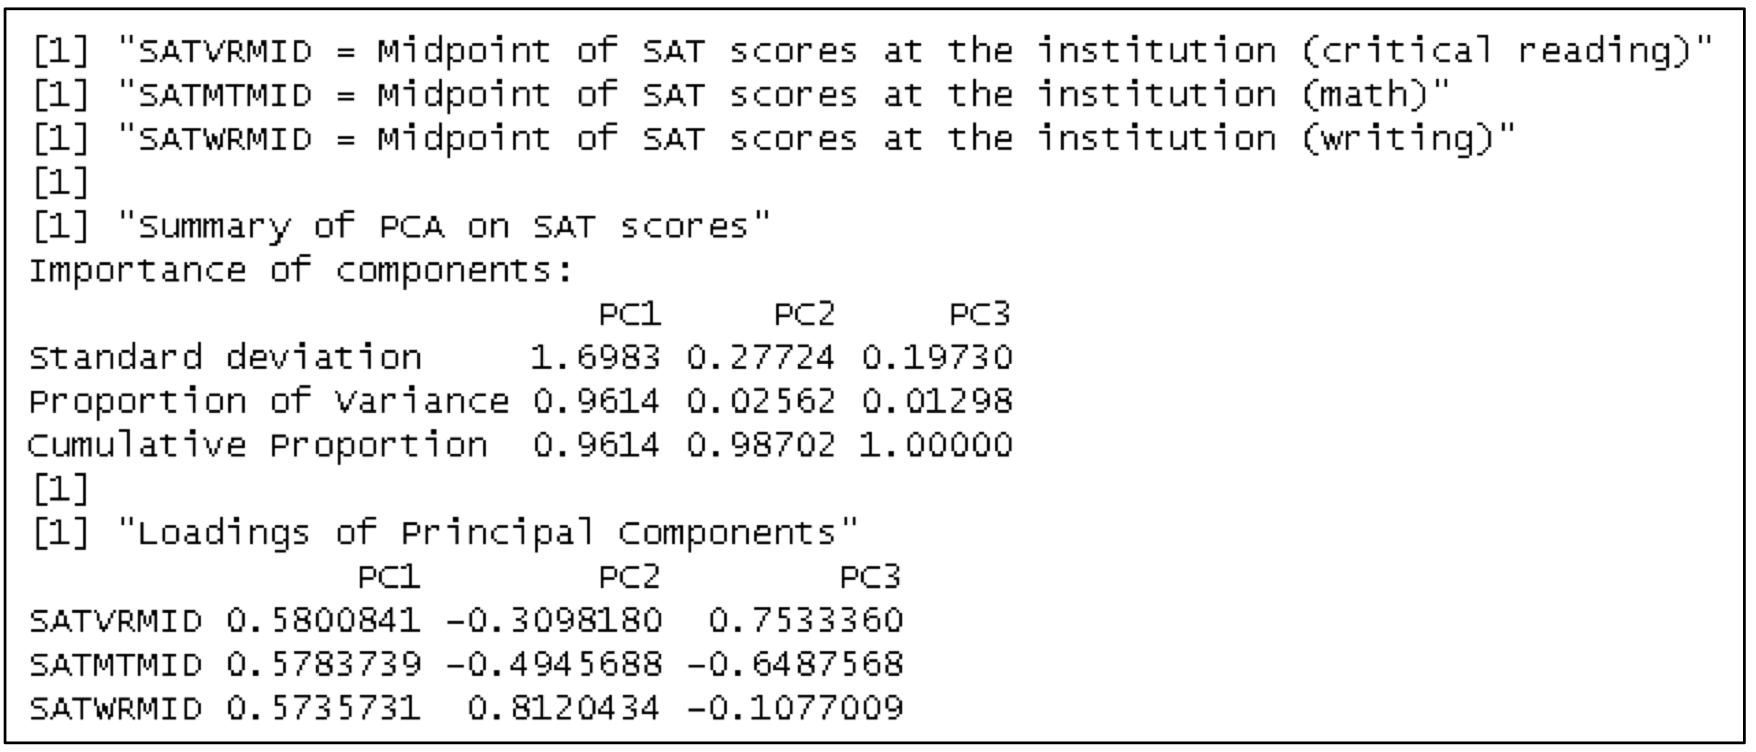
(a) Interpret standard daeviation and proportion of variance in the output.
A standard deviation of 1.6983 implies strong correlation among the three SAT features.
The proportion of variance 0.9614(PC1) implies that the three SAT variables are highly correltated and that it is reasonable to use PC1 as a replacement for the three SAT scores a predictive model.
(b) Interpret the "Loadings of Principal Components" for PC1 and PC2
The similar loading values in PC1 implies that the SAT scores in three-dimensional space fall near the line Writing SAT = Math SAT = Reading SAT. PC1 primarily prepresents the average score because PC1 is correlated with the direction of any of the SAT variables.
PC2 shows that the residual variance not explained by PC1 can be mostly explained by the Reading SAT and the Math SAT being positively correlated with each other and negatively correlated with the Writing SAT.(흠?)
https://www.youtube.com/watch?v=FgakZw6K1QQ
설명변수가 많아질때 차원줄이는 방법론이다 보니 글로 봐선 직관적으로 이해 안됬는데 시각화해서 잘 설명해주는 듯.
https://www.youtube.com/watch?v=HMOI_lkzW08
위 영상보다 컴팩트한 버젼! 뭐있나해서 봤는데 위에꺼 봤으면 아래꺼 안봐도 되긴할듯.
Task10
(a) Explain why tree-based models are resilient to outliers in predictor variables.
By partitioning the outliers, their effect can be isolated from the other leaves, resulting in the body of the distribution being unaffectied.
(b) Recommend which metric to use for outliers in the target variable. RMSE vs MAE
I recommend MAE because it is more robust to outliers. Outliers tend to result in large error terms, which have an outsized impact on RMSE, due to the squaring of the error term.
'SOA > PA' 카테고리의 다른 글
| SOA/ASA/PA 기출 및 내용정리 - 22.10.11시험 Task1~5(기록용) (0) | 2024.04.05 |
|---|---|
| SOA/ASA/PA 기출 및 내용정리 - 23.04시험 Task8~(기록용) (0) | 2024.04.04 |
| SOA/ASA/PA 기출 및 내용정리 - 23.04시험 Task1~4(기록용) (0) | 2024.03.31 |
| SOA/ASA/PA 기출 및 내용정리 - 23.10시험 Task3~4(기록용) (1) | 2024.03.31 |
| SOA/ASA/PA 기출 및 내용정리 - 23.10시험 Task1~2(기록용) (0) | 2024.03.30 |